A practical blueprint for reliable log ingestion, labeling, and automated analysis across thousands of distributed nodes.
In modern data centers and industrial environments, logs are your first line of defense against failure. NIC flaps, PCIe retraining issues, RAID timeouts, thermal throttling, ECC memory alerts, kernel panics — all of them leave signals long before the system collapses.
Yet most organizations still struggle with one issue:
Logs live everywhere, in different formats, collected inconsistently, and impossible to analyze at scale.
As an OEM providing Intel/AMD/industrial motherboards and server platforms, we help clients design hardware-aware, scalable log pipelines that turn raw logs into actionable diagnostics.
This article outlines a practical architecture from node-level collection → aggregation → normalization → time synchronization → labeling → automated analysis.

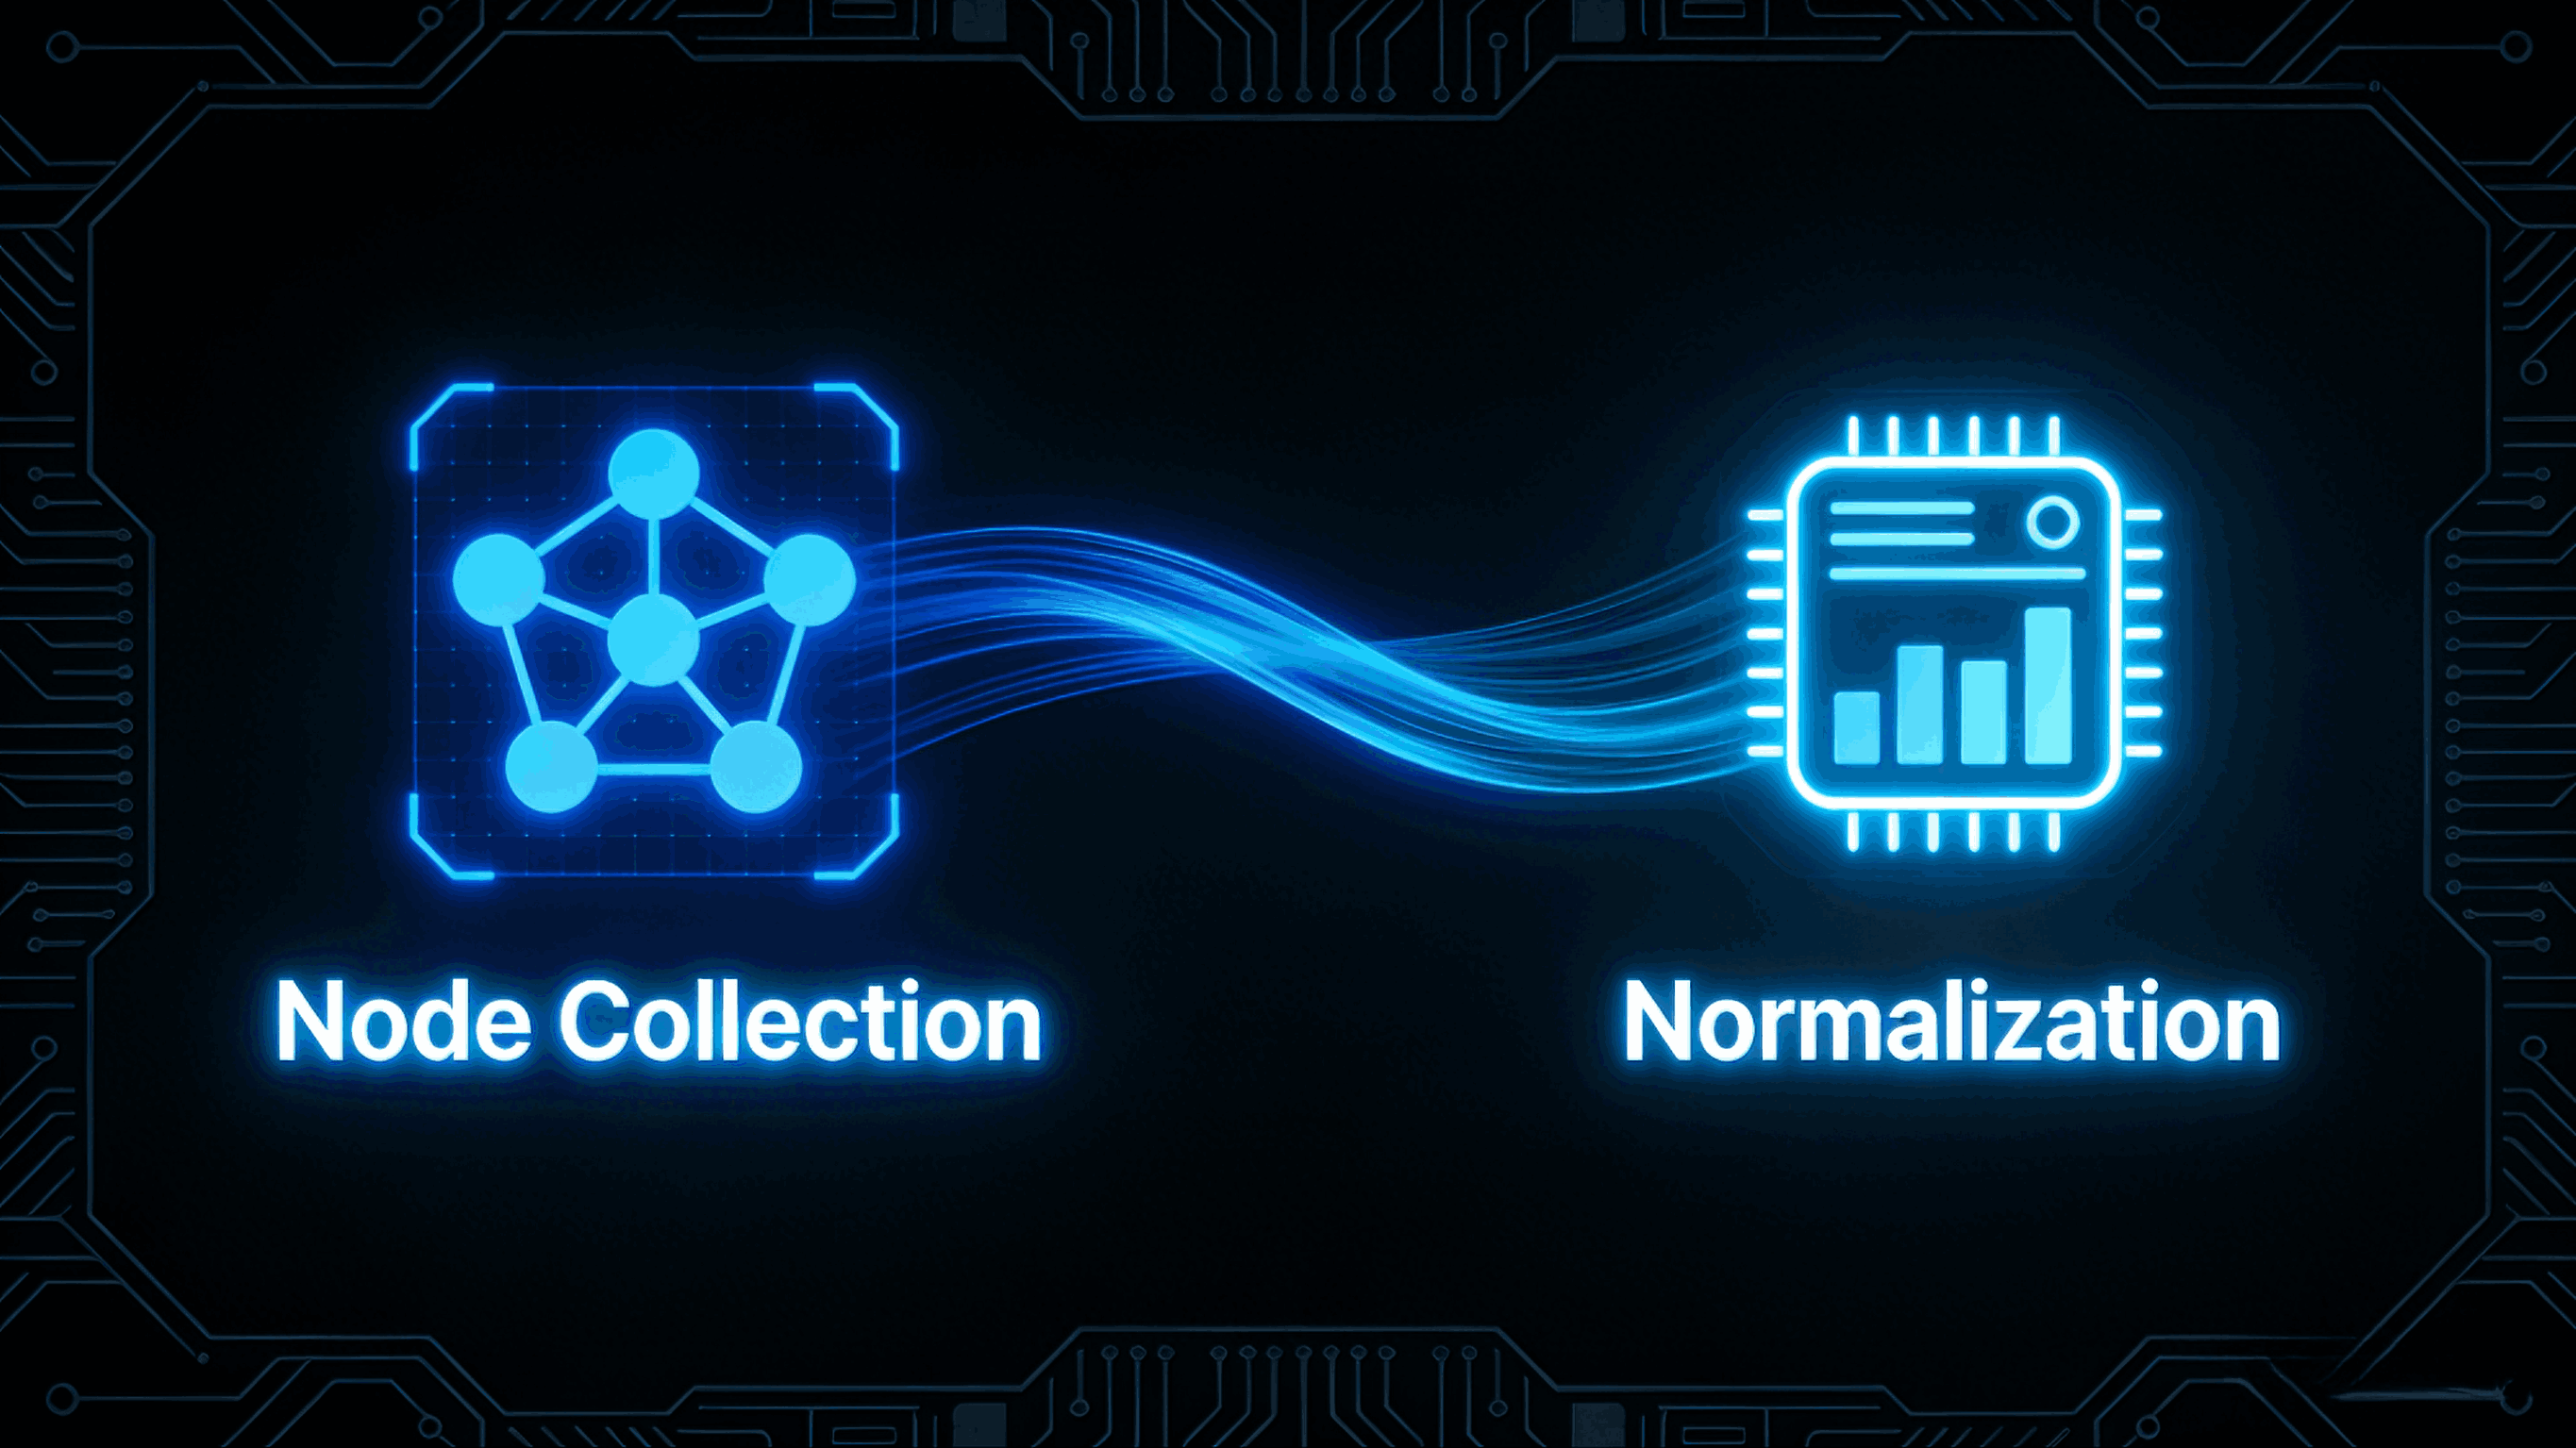
1. Node-Level Log Collection: Start Where the Signals Originate
Every server generates dozens of log sources:
OS logs (dmesg, syslog, journalctl)
BMC/IPMI/Redfish event logs
BIOS POST logs
NIC/RAID/HBA firmware logs
Application and container logs
Hardware telemetry: temperature, fan curves, power, CPU throttling, ECC
But the challenge is consistency.
Best Practices for Node-Side Collection
Deploy a lightweight, resource-safe collector (Fluent Bit, Vector, Beats).
Enable persistent BMC/IPMI/Redfish polling for hardware-level alerts.
Capture firmware logs (NVMe, RAID, NIC) at fixed intervals.
Normalize encoding (UTF-8, JSON preferred).
Tag logs with nodeID + batchID + hardware profile ID to enable drift analysis.
Industrial servers benefit heavily from collectors that tolerate intermittent connectivity and edge-compute conditions.
2. Reliable Aggregation Layer: Don’t Lose Logs During Spikes
At scale, ingestion spikes can reach hundreds of thousands of events per second.
A resilient aggregation architecture typically includes:
Recommended Components
Message Queue (Kafka, Redpanda, Pulsar) for durable buffering
Distributed Log Storage (Elasticsearch, Loki, OpenSearch) for fast indexing
Object Storage (S3/MinIO) for cold archival
Edge Gateways to compress, batch, and retry during poor connectivity
Key Reliability Features
Backpressure handling
Persistent queues on edge nodes
High-availability brokers
Horizontal scaling without coordination overhead
Data centers require throughput; industrial deployments require resilience to unstable networks — both must be accounted for in the design.

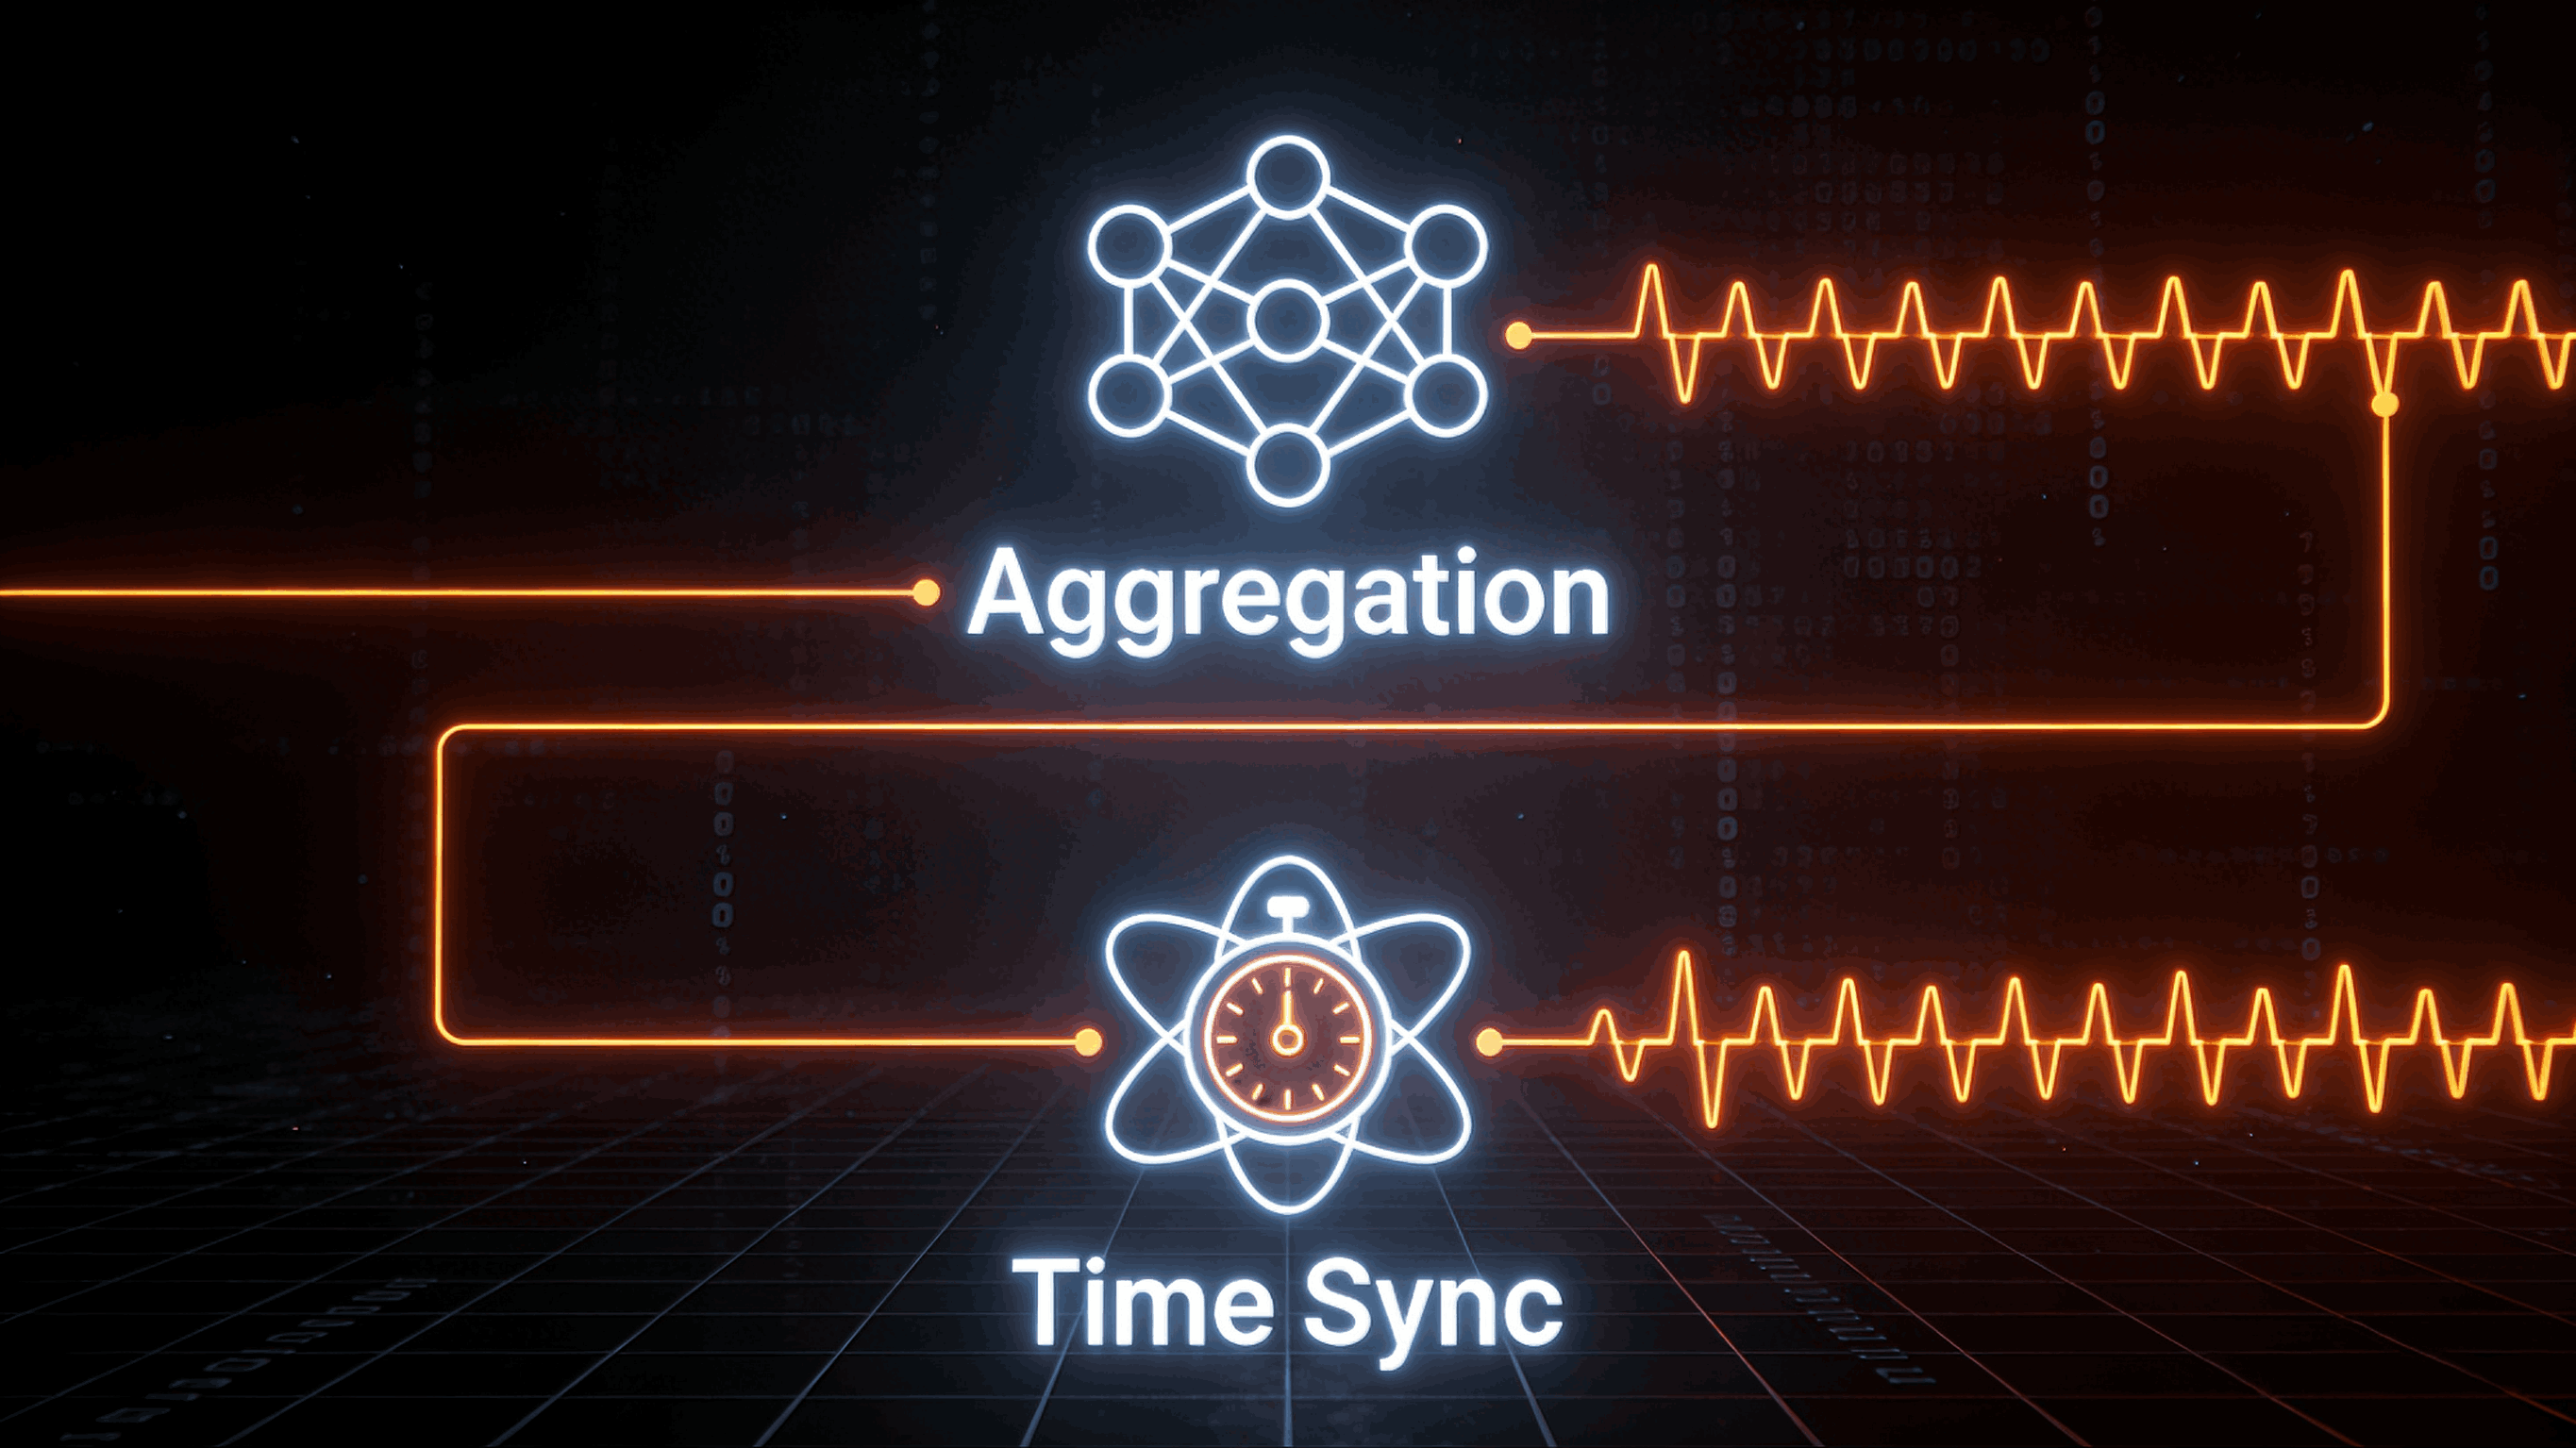
3. Time Synchronization: Accurate Logs Require a Shared Clock
Logs are worthless if timestamps drift.
A NIC flap at 12:01:03 appearing before a thermal event at 12:01:00 can mislead root-cause analysis entirely.
Time Sync Methods
Fleet-wide NTP/PTP hierarchy
BMC-synchronized clocks for out-of-band logs
Timestamp normalization at the collector layer
Detecting drift >±200 ms and triggering alerts
Precision time is especially crucial when correlating:
Every serious log pipeline treats time synchronization as a core dependency, not an afterthought.
4. Normalization & Labeling: Give Logs Structure and Meaning
Raw logs are noisy. To support scalable analysis, logs must be tagged, parsed, and normalized.
Recommended Labeling Scheme
Hardware Profile ID (board model, BIOS version, NIC vendor, DIMM topology)
Deployment Batch ID
Workload Type
Node Role (compute/storage/control/edge)
Severity & Subsystem Tags

Normalization Strategies
Convert all logs to structured JSON
Use schema registries for consistent fields
Parse common hardware signals (e.g., PCIe AER, MCE, IPMI SEL, iLO/BMC logs)
Deduplicate recurring firmware noise
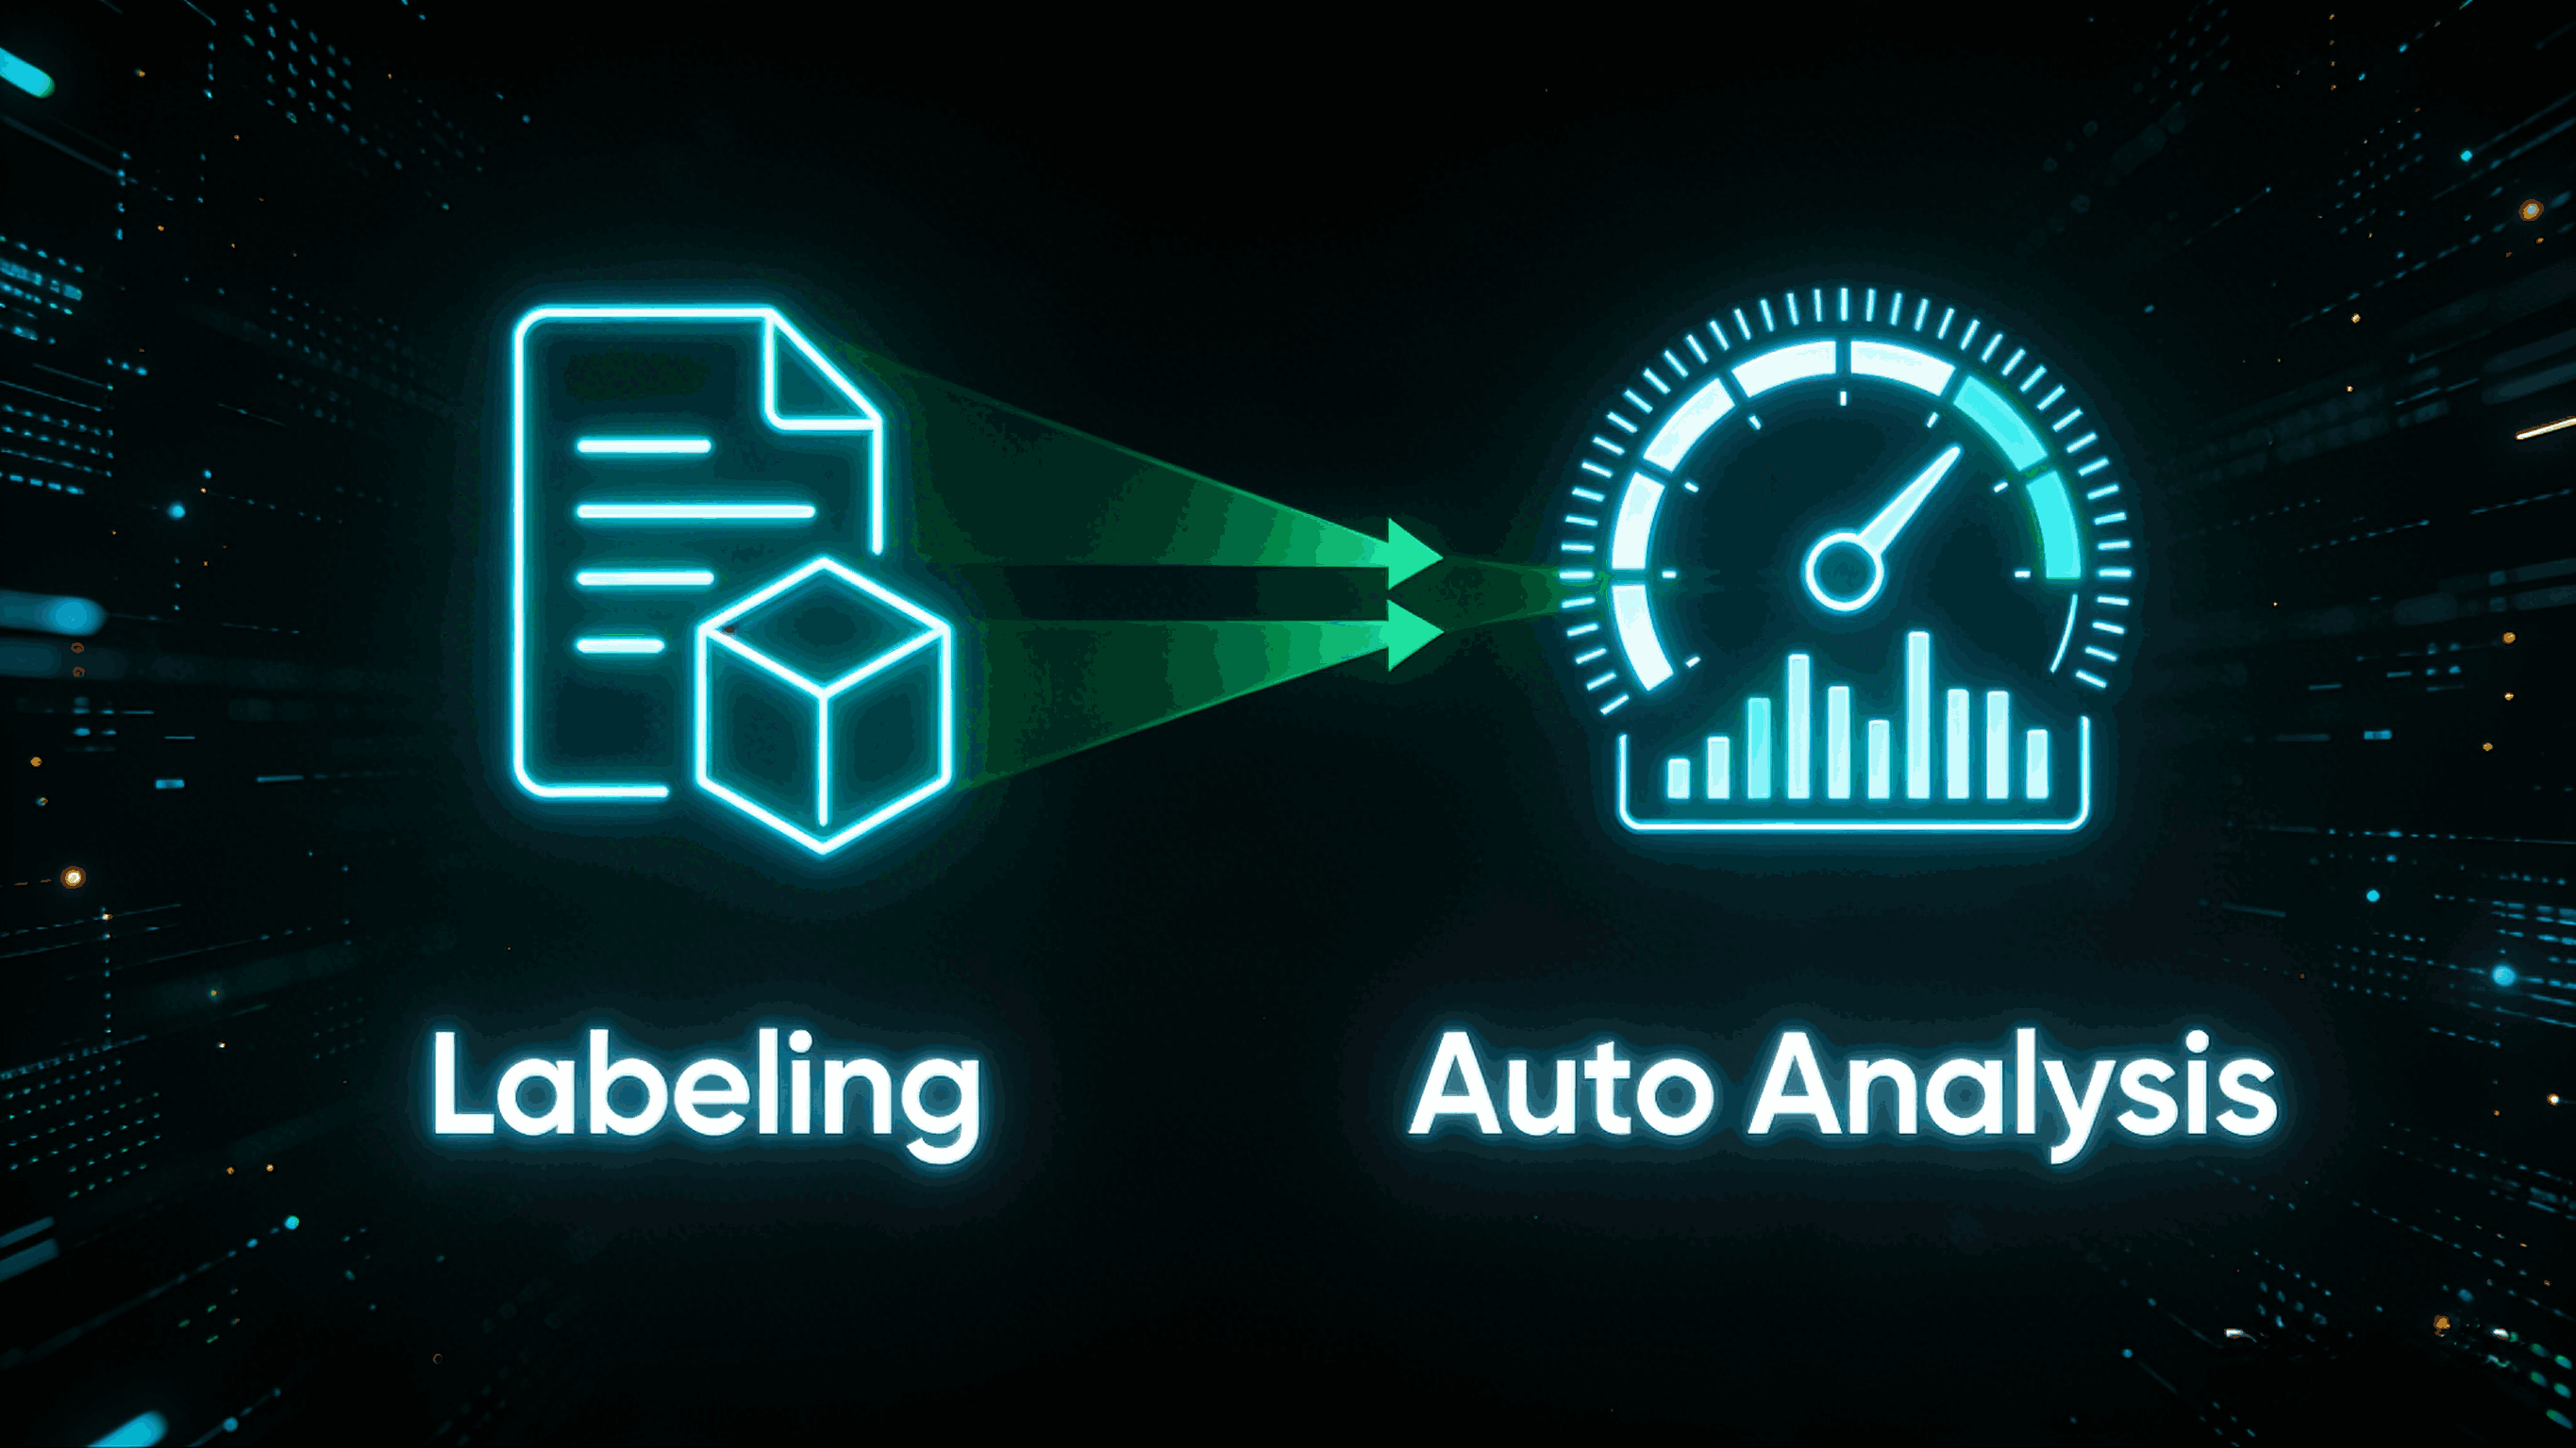
Labeling is the foundation for high-quality root cause correlation later.
5. Automated Analysis: Turn Logs Into Insight, Not Overhead
Once logs are aggregated and labeled, organizations can apply automated analysis:
Rule-Based Detection
NIC link flap detection
RAID timeout + rebuild loops
Thermal throttling sequences
Kernel panic signature matching
PCIe AER recurring errors
Machine Learning & Pattern Recognition
Anomaly detection for drift behavior
Predictive failure detection for SSDs, NICs, PSUs
Multi-signal correlation (CPU throttling + fan anomalies + VRM noise)
Fleet-Level Insights
Which motherboard batch shows more PCIe errors?
Which BIOS version introduces thermal regressions?
Which NIC firmware version causes link instability?
Analysis transforms logs from being a forensics tool after failure to a predictive system that prevents failure.

6. How Angxun Enables Hardware-Aware Log Ecosystems
At Shenzhen Angxun Technology, we help OEMs, cloud providers, and industrial computer vendors build deep hardware-integrated pipelines.
Our capabilities include:
Motherboard-level logging hooks and enhanced BMC telemetry
Stable firmware/BIOS templates for consistent signal mapping
Pre-validated collector modules for NIC/RAID/thermal logs
Batch ID + hardware profile tagging built into manufacturing
Long-term reliability testing to build accurate log signatures
These hardware-level improvements dramatically enhance the accuracy of automated diagnosis platforms built on top of your pipeline.
Conclusion
A scalable log pipeline is no longer optional — it is the backbone of reliability in both data centers and industrial deployments.
To succeed at scale, organizations must design pipelines that incorporate:
Reliable node-level collection
Robust aggregation with buffering
Strict time synchronization
Structured labeling & normalization
Automated rule-based + ML analysis
With the right architecture, logs stop being noise — they become a continuous telemetry system for performance, safety, and predictive maintenance.
